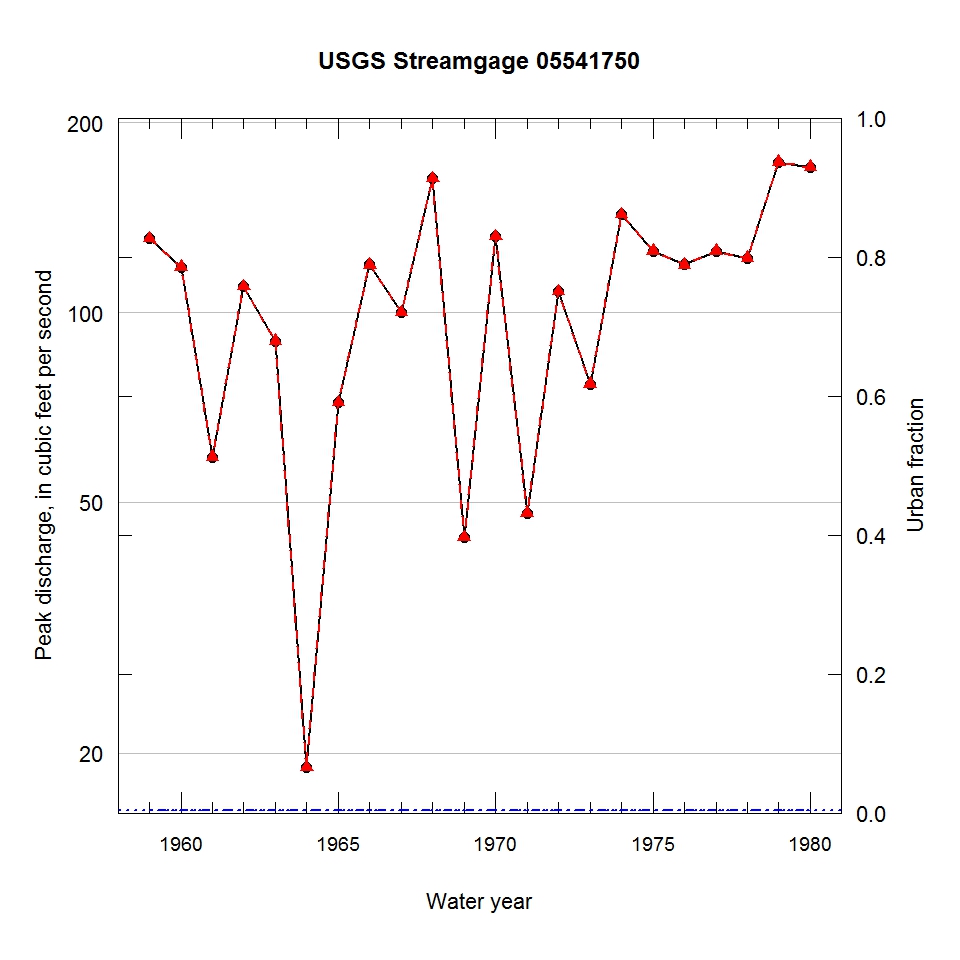
Observed and urbanization-adjusted annual maximum peak discharge and associated urban fraction and precipitation values at USGS streamgage:
05541750 MAZON RIVER TRIBUTARY NEAR GARDNER, IL


| Water year | Segment | Discharge code | Cumulative reservoir storage (acre-feet) | Urban fraction | Precipitation (inches) | Observed peak discharge (ft3/s) | Adjusted peak discharge (ft3/s) | Exceedance probability |
| 1959 | 1 | -- | 0 | 0.003 | 0.663 | 131 | 131 | 0.352 |
| 1960 | 1 | -- | 0 | 0.003 | 0.022 | 118 | 118 | 0.418 |
| 1961 | 1 | -- | 0 | 0.003 | 1.340 | 59 | 59 | 0.811 |
| 1962 | 1 | -- | 0 | 0.003 | 0.305 | 110 | 110 | 0.468 |
| 1963 | 1 | -- | 0 | 0.003 | 0.544 | 90 | 90 | 0.612 |
| 1964 | 1 | -- | 0 | 0.003 | 1.195 | 19 | 19 | 0.977 |
| 1965 | 1 | -- | 0 | 0.003 | 0.202 | 72 | 72 | 0.731 |
| 1966 | 1 | -- | 0 | 0.003 | 1.408 | 119 | 119 | 0.413 |
| 1967 | 1 | -- | 0 | 0.003 | 1.054 | 100 | 100 | 0.537 |
| 1968 | 1 | -- | 0 | 0.003 | 1.954 | 163 | 163 | 0.219 |
| 1969 | 1 | -- | 0 | 0.003 | 0.380 | 44 | 44 | 0.891 |
| 1970 | 1 | -- | 0 | 0.003 | 1.641 | 132 | 132 | 0.347 |
| 1971 | 1 | -- | 0 | 0.003 | 0.893 | 48 | 48 | 0.873 |
| 1972 | 1 | -- | 0 | 0.003 | 0.831 | 108 | 108 | 0.480 |
| 1973 | 1 | 2 | 0 | 0.003 | 0.977 | 77 | 77 | 0.697 |
| 1974 | 1 | -- | 0 | 0.003 | 1.045 | 143 | 143 | 0.298 |
| 1975 | 1 | -- | 0 | 0.003 | 0.647 | 125 | 125 | 0.381 |
| 1976 | 1 | -- | 0 | 0.003 | 0.549 | 119 | 119 | 0.413 |
| 1977 | 1 | -- | 0 | 0.003 | 1.403 | 125 | 125 | 0.381 |
| 1978 | 1 | -- | 0 | 0.003 | 0.864 | 122 | 122 | 0.396 |
| 1979 | 1 | -- | 0 | 0.003 | 1.254 | 173 | 173 | 0.189 |
| 1980 | 1 | -- | 0 | 0.003 | 0.556 | 170 | 170 | 0.196 |

